Troubleshoot Using Browser Network Tab
Objective: To provide users with additional information on the error messages on UI.
Network Tab
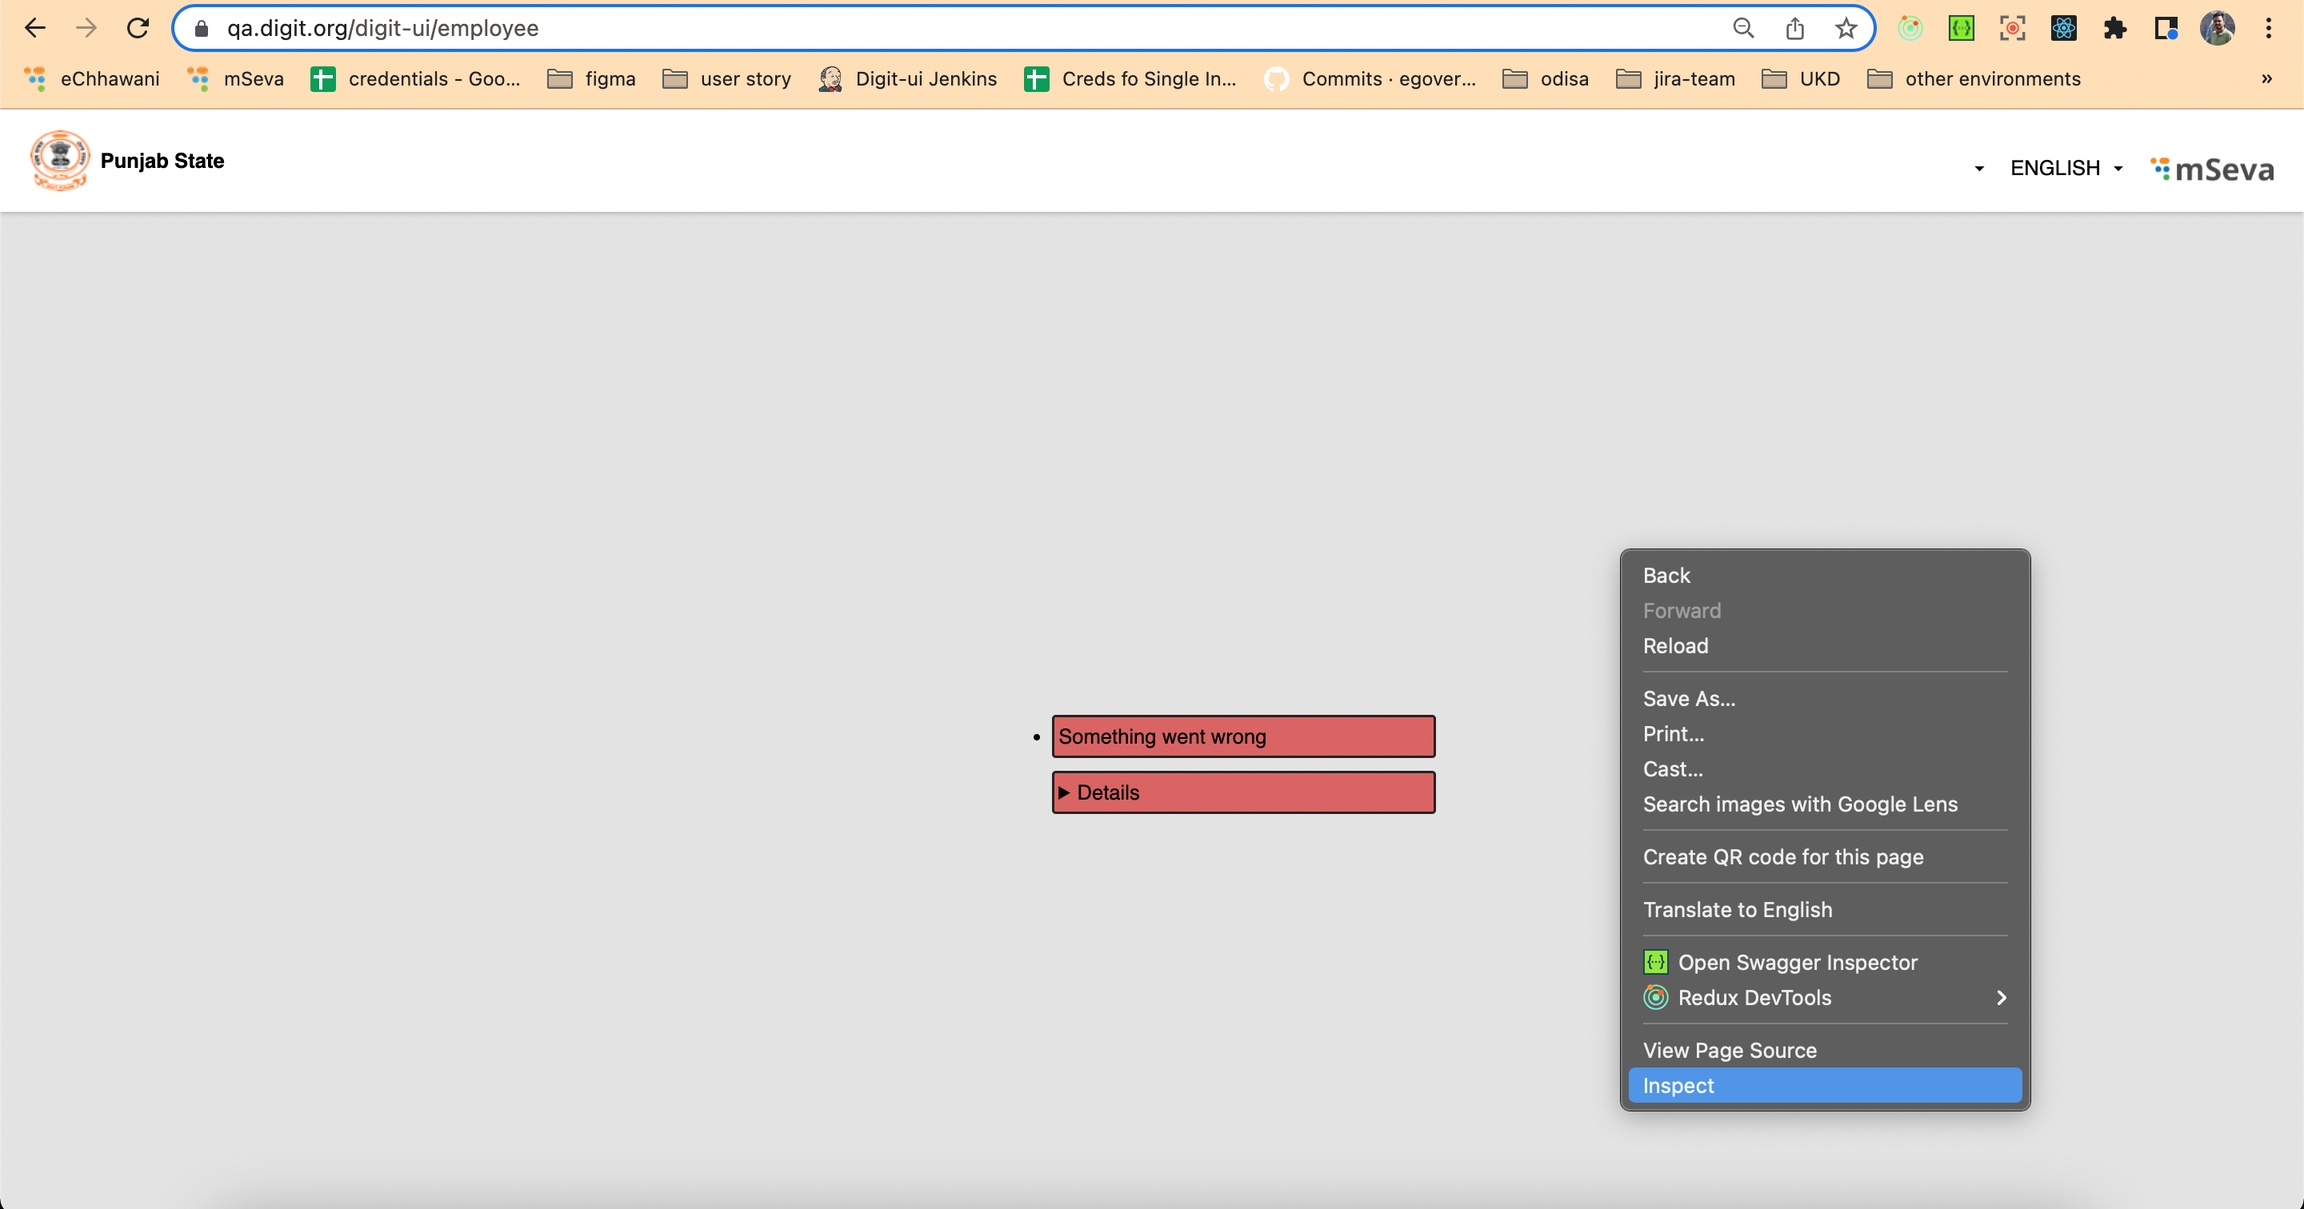
Generic error messages may appear on the UI while using the application and performing some action. For instance, Something went wrong / Please try again or contact support.

Despite trying again, the same error message pops back up. What else could go wrong? The Network tab provides users with more information about the error.
The steps below provide detailed information on using the Network Tab.
Step 1: Inspect the Page On the page with the error message, right-click anywhere on the page. Click on Inspect in the dropdown menu.
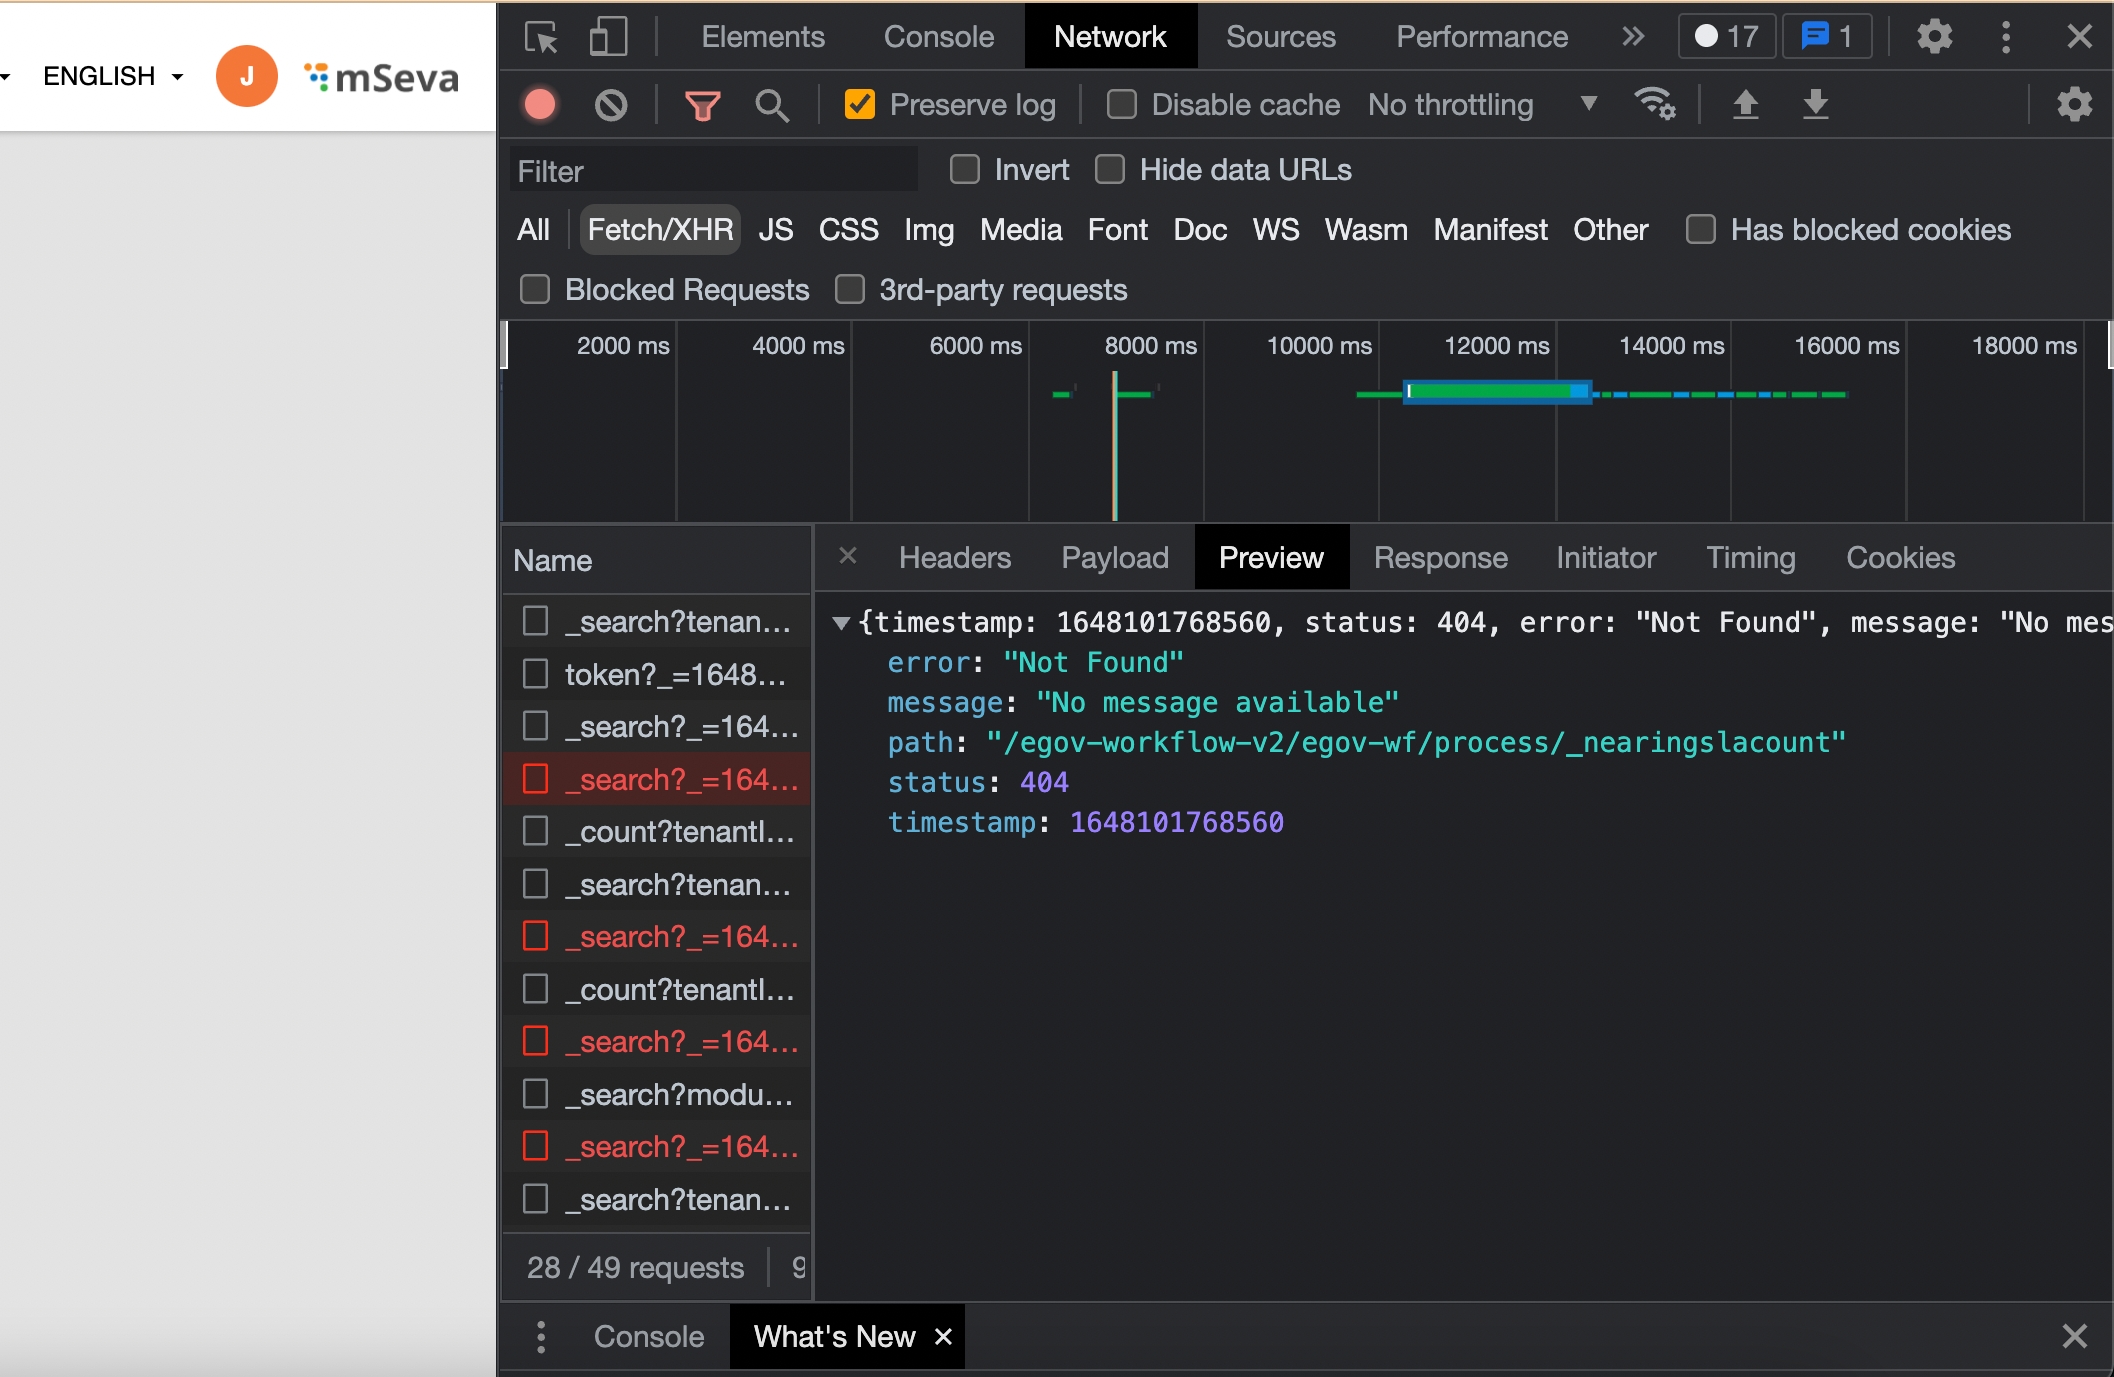
Step 2: Select the Network Tab The browser’s network tab offers a way to look directly at what’s happening behind the scenes of a page. It offers not only the type of data being requested and passed as we interact with the page, but also provides information on any actions that are failing. After selecting Inspect, a new window pops up. Click on the Network tab on this window. Select the XHR filter option. This hides everything except API requests.
Step 3: Refresh the Page Click the Refresh button on your browser. Since the Network tab displays the requests that occur after the tab has been opened, refreshing the page enables users to view the error as it occurs. The various API request details appear on the page as it reloads.
Step 4: Re-create the Error The error needs to be re-created to understand what is causing it. This is done by repeating the steps that led to the error. For instance, clicking on Update re-creates the error and the panel pinpoints the request that is causing the issue.

Step 5: Find the Red-Line Item in the Network Panel The line item appearing in red is the error. The status reflected on the image above is 404, which is the error code for a bad request. If the status is 200, it means the code is OK and there is nothing wrong with these requests.
Step 6: Preview the Error Details Click on the red-line item to see the error details. Clicking on that line item opens a new frame on the right-hand side. The tabs in this frame include Headers, Preview, Response, Cookies, and Timing. Click on Preview since this contains the basic information.
Step 7: View the Error Message
There is no specific message in some cases. In this instance, the following message is displayed:
error: "Not Found"
message: "No message available"
path: "/egov-workflow-v2/egov-wf/process/_nearingslacount"
status: 404
Thanks to the network panel, it allows users to diagnose the issue and apply a fix.
![]() All content on this page by eGov Foundation is licensed under a Creative Commons Attribution 4.0 International License.
All content on this page by eGov Foundation is licensed under a Creative Commons Attribution 4.0 International License.
Was this helpful?